Statistics – Lies or science?
First article by our newest Awesome Author, Wynand Serfontein, who says: “After reading some of the comments on the posts of the last few months, I observed a possible lack of understanding about measurement, statistics and predictions. I thought it would be prudent to try and clarify the mystique surrounding statistics with a basic description of what statistics is, and what it does not do. My aim is to try and lift the level of discussions about measurements and physical parameters to a level where the issues discussed are addressing the topic”
 There have been a lot of discussions on statistics, predictive value, predictions and managing the future. I am not an expert on any of these fields, but I did notice what I perceive to be a lack of understanding about predictions and statistics.
Predictions
There are two kinds of predictions –
- The one I will call “prophetic” where a statement is made, normally by a person, about what will happen in future. Prophetic predictions are usually made with the view that the predictor has some foresight in the future that other people do not have.
- The statistical prediction uses mathematical processes to either use history to predict how likely it is that the same event will occur in future, or use past information and correlations to look for expected future trends. The weather forecast is a good example. If a certain set of measurements correlated to rain in the past, we forecast that the same set of measurements will correlate to rain in the future. Therefore, if we measure a set of values today, we say that we expect tomorrow to have the same weather as the day after the previous time this set of measurements were recorded. The accuracy of the forecast is largely dependent on whether we identify the correct correlations. Since the amount of correlations is enormous, the possibility if excluding an important correlation is large, therefore sometimes we forecast incorrectly
Statistical prediction is a scientific process, and it is only as good as the accuracy of the input parameters. We cannot really say “this is what will happen”, what we actually say is “our calculations indicate that this situation from the past will repeat itself.”
Confidence intervals
The word “confidence” in statistics has a different meaning than in general conversations. In statistics, it is a calculation of the cumulative effect of inaccuracies. If we say a value is in the 95% confidence interval, it says that there is a 95% chance that the correct value is in the interval. For this one I need a mathematical example:
Let us use speed measurement as an example:
Reading on speedometer: 104km/h
Real speed: 100km/h
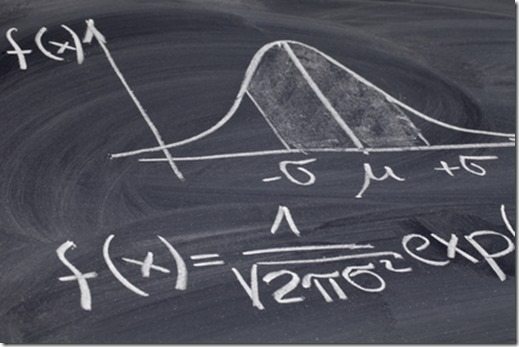
This means your speedometer is only 95% accurate at 100km/h. However, since “real speed” is not known, you can only give the number on your meter, which is 95% accurate. If I would measure your speed with 20 different speedometers, each one 95% accurate, what is your real speed? So we draw a graph of how many times each value is measured, and this graph is typically a bell shaped curve. The real speed is somewhere on the graph – only nobody knows where. We therefore assume that the real speed is close to the average of all the readings. However, I can say with 100% accuracy that the real speed is somewhere between (say) 0 and 200km/h. If I make this interval smaller, say between 97 and 103km/h, I am only 93% sure that the real speed is in that interval.
What statistics now did was to calculate how likely it is that the real speed is in that interval.
Another use of confidence interval has to do with measurement accuracy. In physical sciences, if I say something weighs 10.5kg, it actually means it weighs between 10.45 and 10.54 kg. This means I am unsure about 90g of the total mass. Now if I add another item weighing 4.0 kg (between 3.95 and 4.04 kg), I have a total of 180g that I am unsure of. It is assumed that the uncertainties will cancel out, so we calculate how unsure we are about the weight. This is also called confidence, and has nothing to do with how much I trust the value, but with the size of the accumulated error.
Interpretation
I simplified two of the most basic concepts to illustrate my points. I can statistically calculate from a range of measurements how accurate a measurement is. I can combine this with a predictive calculation that can tell me how likely it is that the result of my calculation will correlate with a known historical result, and I can predict that the historical result will correlate to a future result.
Here is where a lot of misunderstanding happens. My prediction is based on the assumption that I captured all the relevant factors in the calculation. If the numbers in the calculation are not correlating to the past event, the prediction of the future event will be very inaccurate.
Another item that is often misunderstood is the “1 in 100 probability”, or “once in 200 years”. It does not mean that it WILL happen once every 100 times or every 200 years. It typically means something like “There is a 95% chance that, if you repeat an event 100 times, at least once the event in question will happen”. It means “There is a 95% chance that sometime in the next 200 years, the event will happen”. This can be tomorrow, in 200 years or never – statistics work with non-positional numbers so there is no indication of when in the sequence of events the predicted one will happen. It also does not mean it can only happen once – it is only a mathematical number of what you can reasonably expect.
The reader will notice the liberal use of terms like assume, expect, reasonably, likely. This is because the whole study of statistics is about giving uncertainties a value. It is therefore highly irresponsible to use the result from a statistical prediction as a given.
Humanising
The human brain does not work along statistics. Our thinking process uses past experiences and link it to current situations, and even create expectations. However, since there is a constant interaction with the environment, it influences those factors continuously to manage the expected outcomes. Unlike statistics that use fixed values, we think interactively. I expect to eat an ice cream. This causes me to take a certain action – go and buy the ice cream. Once that interaction happens, it is completely different from statistics.
Another aspect of the human interaction – when we hear terms like “prediction”, “likelihood”, “probability”, “confidence”, we make associations according to our understanding of these terms. Certain emotions and cultural links are made that influences the whole thought process. It is therefore difficult. Using an internet forum as discussion medium would further complicate this issue, since the immediate interaction needed to resolve the confusion is often absent.


Do you have any thoughts? Please share them below